You ever wants to know which tactics Prisma Cloud covers and which techniques which leading to this tactics will be detected by Prisma Cloud?
Here you go.
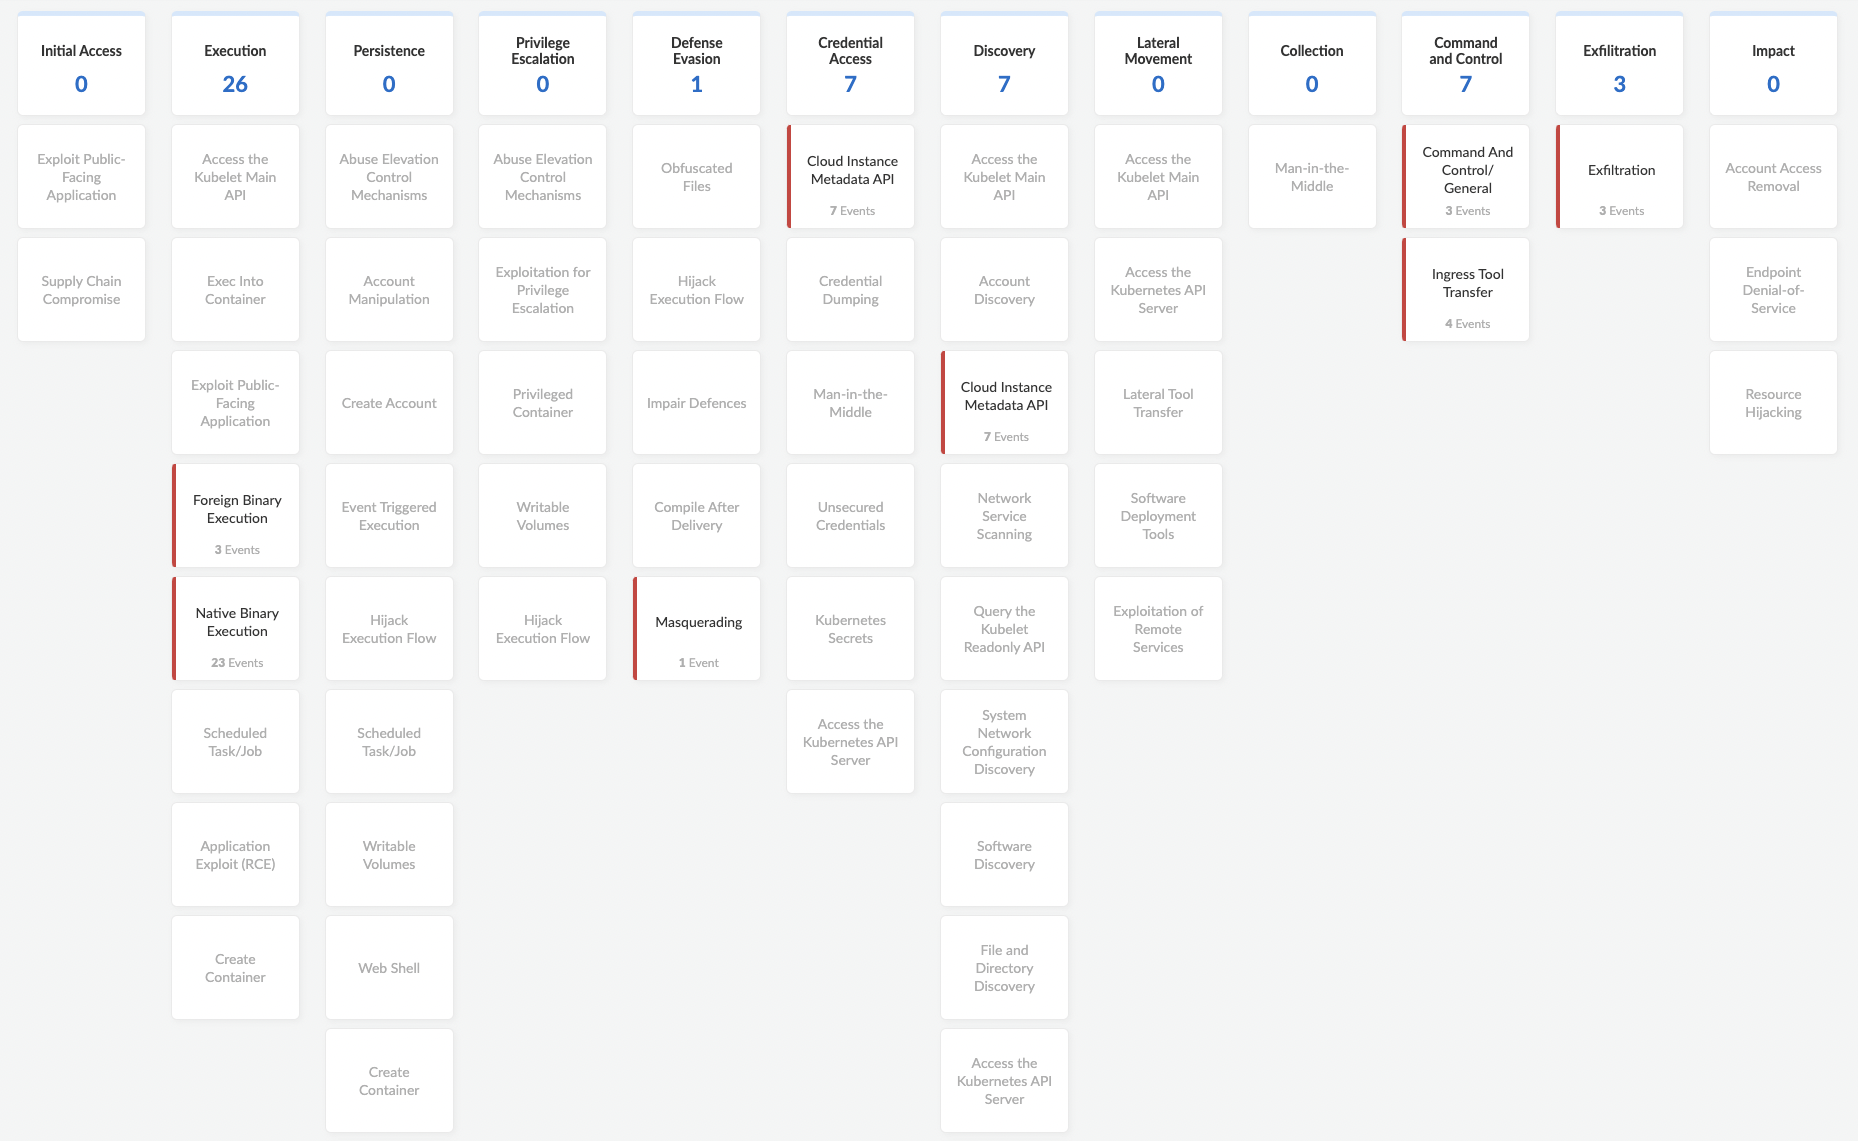
In Prisma Cloud Compute we have the ATT&CK Explorer (Prisma Cloud Console – Compute – Monitor – ATT&CK). In that Explorer (Dashboard) we list the detected threats and assign them to the attack techniques and tactic. That means at the top row you see the tactics and in each columns the techniques that can be used to achieve the tactic. One tile for each technique. The number at the top show the sum of all Events and Incidents corresponding to all techniques in the column.
To be clear here, we are only covering certain but not all techniques in each tactic of the MITRE ATT&CK Framework. For an example, in the Credential Access we are only covering 7 out of 17. The covered ones can be solved by Prisma Cloud. To get a better overview of the MITRE Framework take a look at the official site here. The up2date ATT&CK v12 you will find here.
But how the ATT&CK Explorer look like in Prisma?
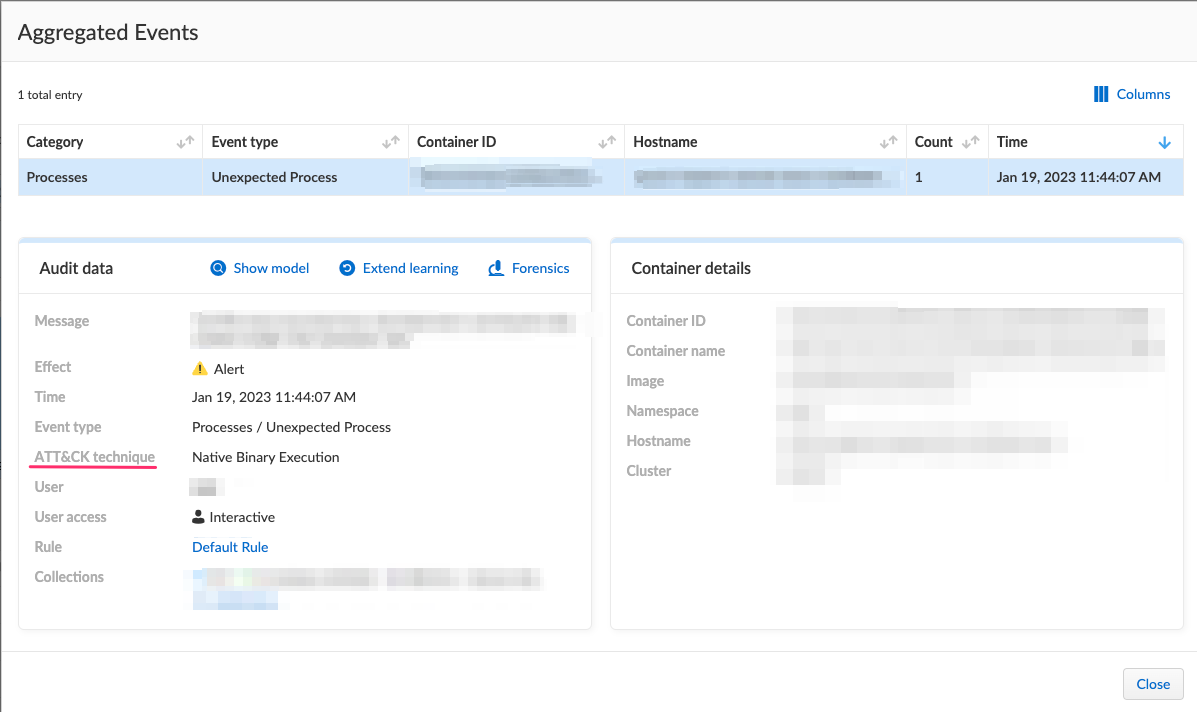
In the tiles we show you the Events (which you can find under Monitor – Events) and Incidents (which you find under Monitor – Runtime – Active Incidents). See the examples below for an triggered Event and Incident.
Event (Process / Unexpected Process)
Incident (Cloud Instance Metadata API)
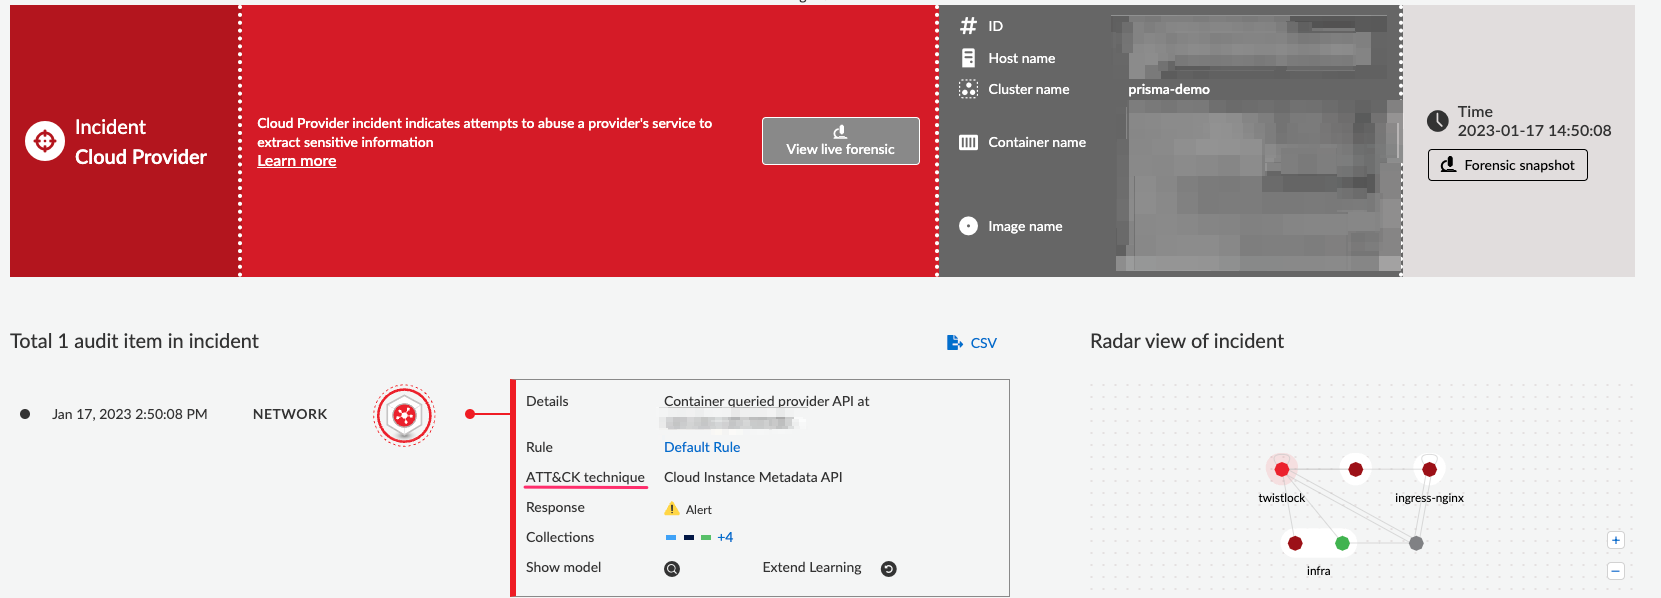
The cool thing here in the Incident section is, that you can see live Forensic data. In that you can see all Incidents on a timeline which means, which host or profile is effected and what happened at which time. Further you will see things like Listening Port, runtime audits or DNS queries. Of course you can export the data package (JSON file) for further analytics (offline if you want). Two ways to do it, download the whole package or selective for each “topic”.
The following Incident types are available within Prisma Cloud:
- Altered binary
- Backdoor admin accounts
- Backdoor SSH access
- Brute force
- Crypto miners
- Execution flow hijack attempt
- Kubernetes attack
- Lateral movement
- Malware
- Port scanning
- Reverse shell
- Suspicious binary
For a general overview as a starting point, take a look at the admin guide for Incident types by Prisma Cloud version (Enterprise)(Self-Hosted).
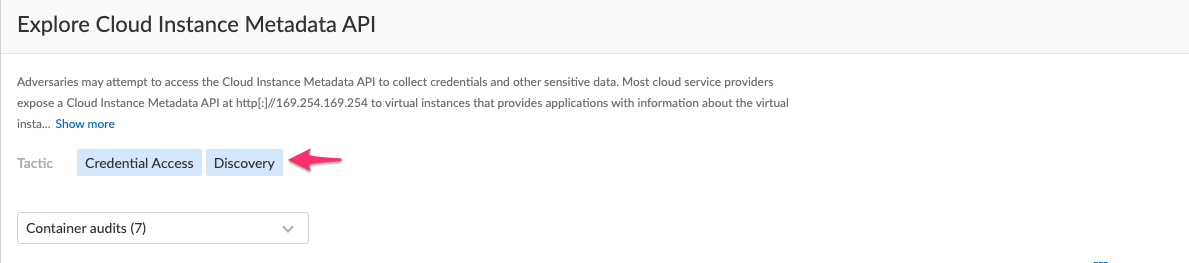
If an Event or Incident is inserted into the Dashboard (ATT&CK Explorer) you will see the tactic which is effected and which technique was used. Another way to see that, especially if an Event or Incident effect more than one tactic, you can click on one of the tiles. You will see the tactic or tactics which are effected. There you can see all details like techniques which are used, time, Effect type (Alert for instance), the Container ID or Container name etc.
On which version of the MITRE ATT&CK Matrix / Framework does Prisma Cloud is based in his current version?
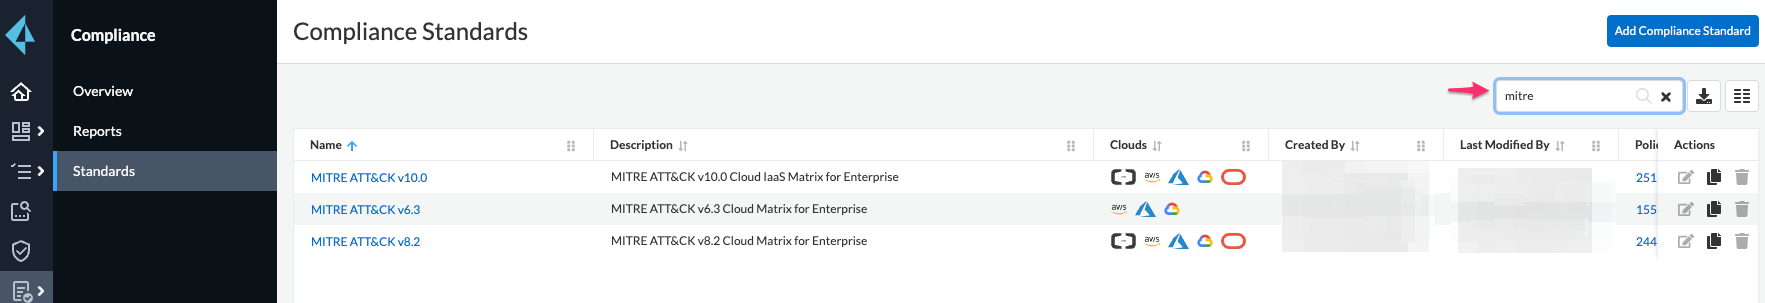
As a first step you can check the following: Prisma Cloud Console – Compliance on the left – Standards. On the top right, type MITRE in the search box to filter.
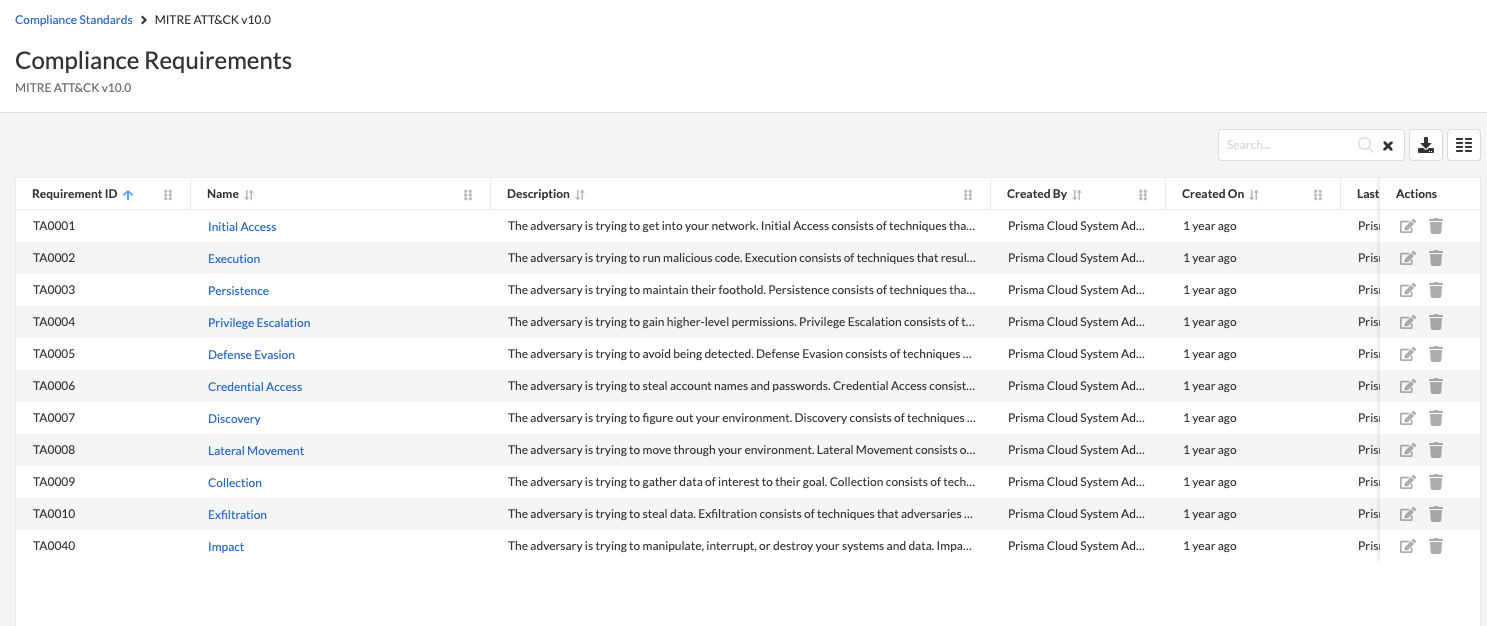
If you now click on one of the versions of MITRE, version v10.0 in that case, you will see a list of tactics which will be covered.
Now we drill it more down. Click on one of the tactics in the list, for instance on “Initial Access.” Then you get the corresponding IDs of the techniques which will match to the MITRE ATT&CK Matrix for Enterprise and the tactics.
Technique IDs to tactics of the MITRE ATT&CK Matrix for Enterprise:
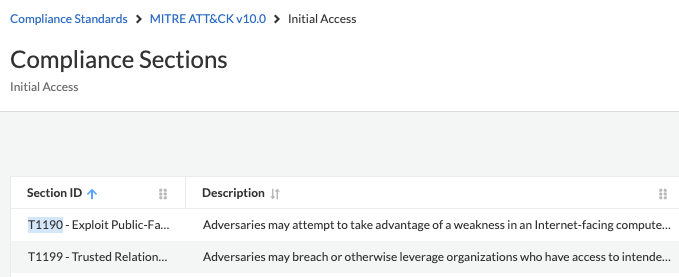
If you hover over the description, you will get all details of the technique inclusive the source link to the official website of MITRE and the technique.