Big data analytics is a huge topic. In the IT world, data are very important on the one side but the analysis of these sometimes a challenge.
In that case it´s important to have a toolset or solution at hand to make the analysis of the data easier and more understandable. Because that topics is very interesting I took a look what’s out there and had the chance to test Starburst a bit.
Starburst is a startup which has that kind of solution. But not only that, you can consolidate or federate data in your queries to have an overview and combined view of the data. That gives you the chance to get a better understanding of what the data can deliver to you and why the analysis is such important.
Here I will focus on Starburst Galaxy, the Cloud based solution. There is the on-premise version as well, which is the Starburst Enterprise.
Let me make an example.
You have data stored in a Data Warehouse database and others in a Data Lake in a different location. That location can be in the Cloud, on-premise or in a hybrid model. In the one data source (Data Warehouse) you have stored the Customer Information. In the other (Data Lake) you have stored the payment hostory.
Let us take a view on the solution and what´s possible. I use the STAR method here to give it a clear structure.
Situation
Now, you want to understand and get a report for your CFO and risk department, which people with first- and last name, and Customer ID has more then 3 delinquent payments in their history and a FICO score less than 500.
Task
Create a Report with actionable data for your CFO, Risk department and Data Analyst team.
Here is where Starburst comes into the game and can help you.
Starburst can handle different data sources, from different locations and consolidate the results in one overview. You can of course have a table overview but the very cool thing is, you can use your favourite BI tool to have a kind of a Dashboard overview. The visualisation of data is a very important part of the analysis and makes it easier to understand.
Set the base
Some base information we use here, what the challenge is and how Starburst will help.
Data source 1:
Data Lake holds the payment history information
Data source 2:
Data Warehouse holds the customer and Account information
The Starburst Galaxy Data Lakehouse connector will be used to access the data. Connect the Data Warehouse through data federation.
The PostGreSQL connector will be used to access the Data Warehouse.
Action
For the different data sources we will create separate catalogs in Starburst Galaxy. There are possibilities to have data sources in the same catalog, here we will cover it with different ones. For the Data Lake we use AWS S3 and for the Data Warehouse PostGreSQL.
Important: Each Data source has it´s own Credentials to limit the access.
Lastly, we create a Cluster, which is at the end the “working” resource for our data.
Important: From a cost efficiency standpoint, all data sources and the Starburst Galaxy Cluster should be in the same Cloud region to reduce the Cloud costs.
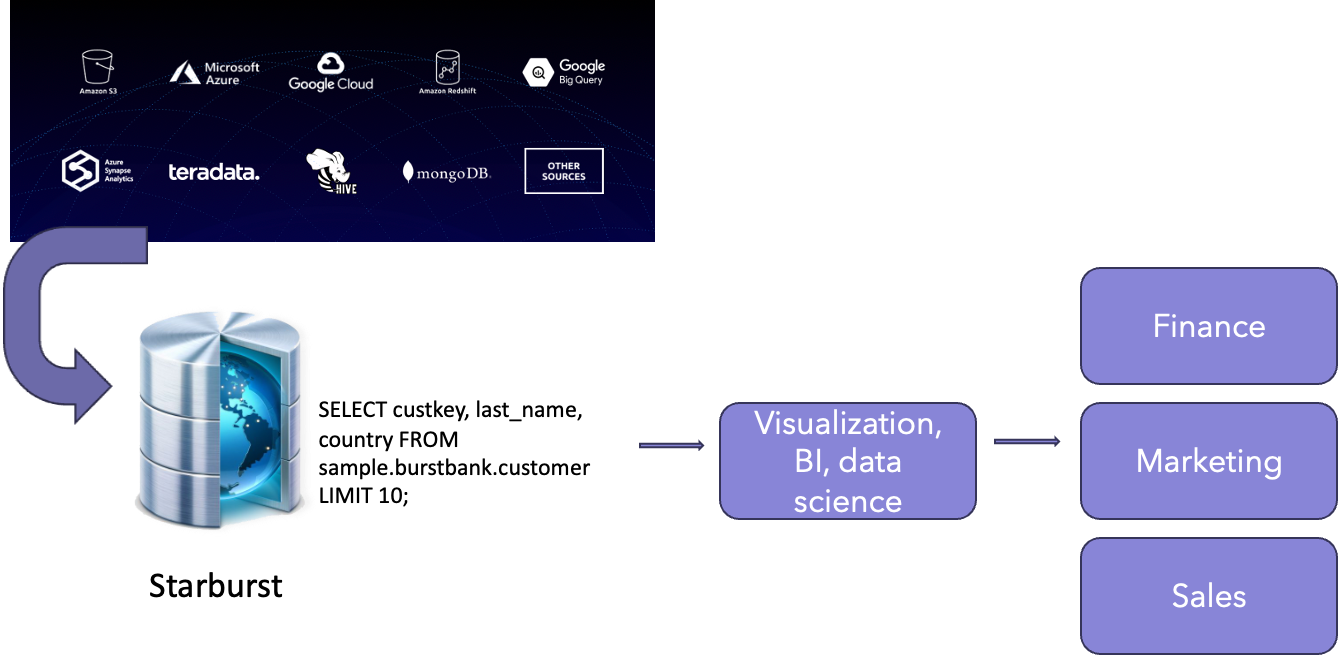
Use SQL to join data warehouse and data Lake and run federated query to get the results needed.
Result
We use the federated SQL statement across a Data Warehouse and a Data Lake to create the critical report the CFO, risk department and Data Analyst needs.
Of course you can query the data in each of the data sources itself. But the great thing here is to have a complete overview of the federated data which gives you the chance to a all the information in one overview or report.
The query we use joins data from tables within the same cluster. Starburst Galaxy makes it easy to joins tables from different data sources (Data Lake and Data Warehouse in our case) using data federation.
We need a JOIN for linking the customer ID and the auto loan ID. We use the boolean logic for the delinquency of the account. As a condition we use the true parameter (great than 3). Finally, we aggregate the result using the GROUP BY parameter.
The query will returns several fields from different data sources:
On the Customer side:
- The customer´s first name
- The customer´s last name
- Their FICO score
On the auto sales side:
- The auto loan ID
- The data that the loan was opened
- A List of delinquent payments
High Level Architecture
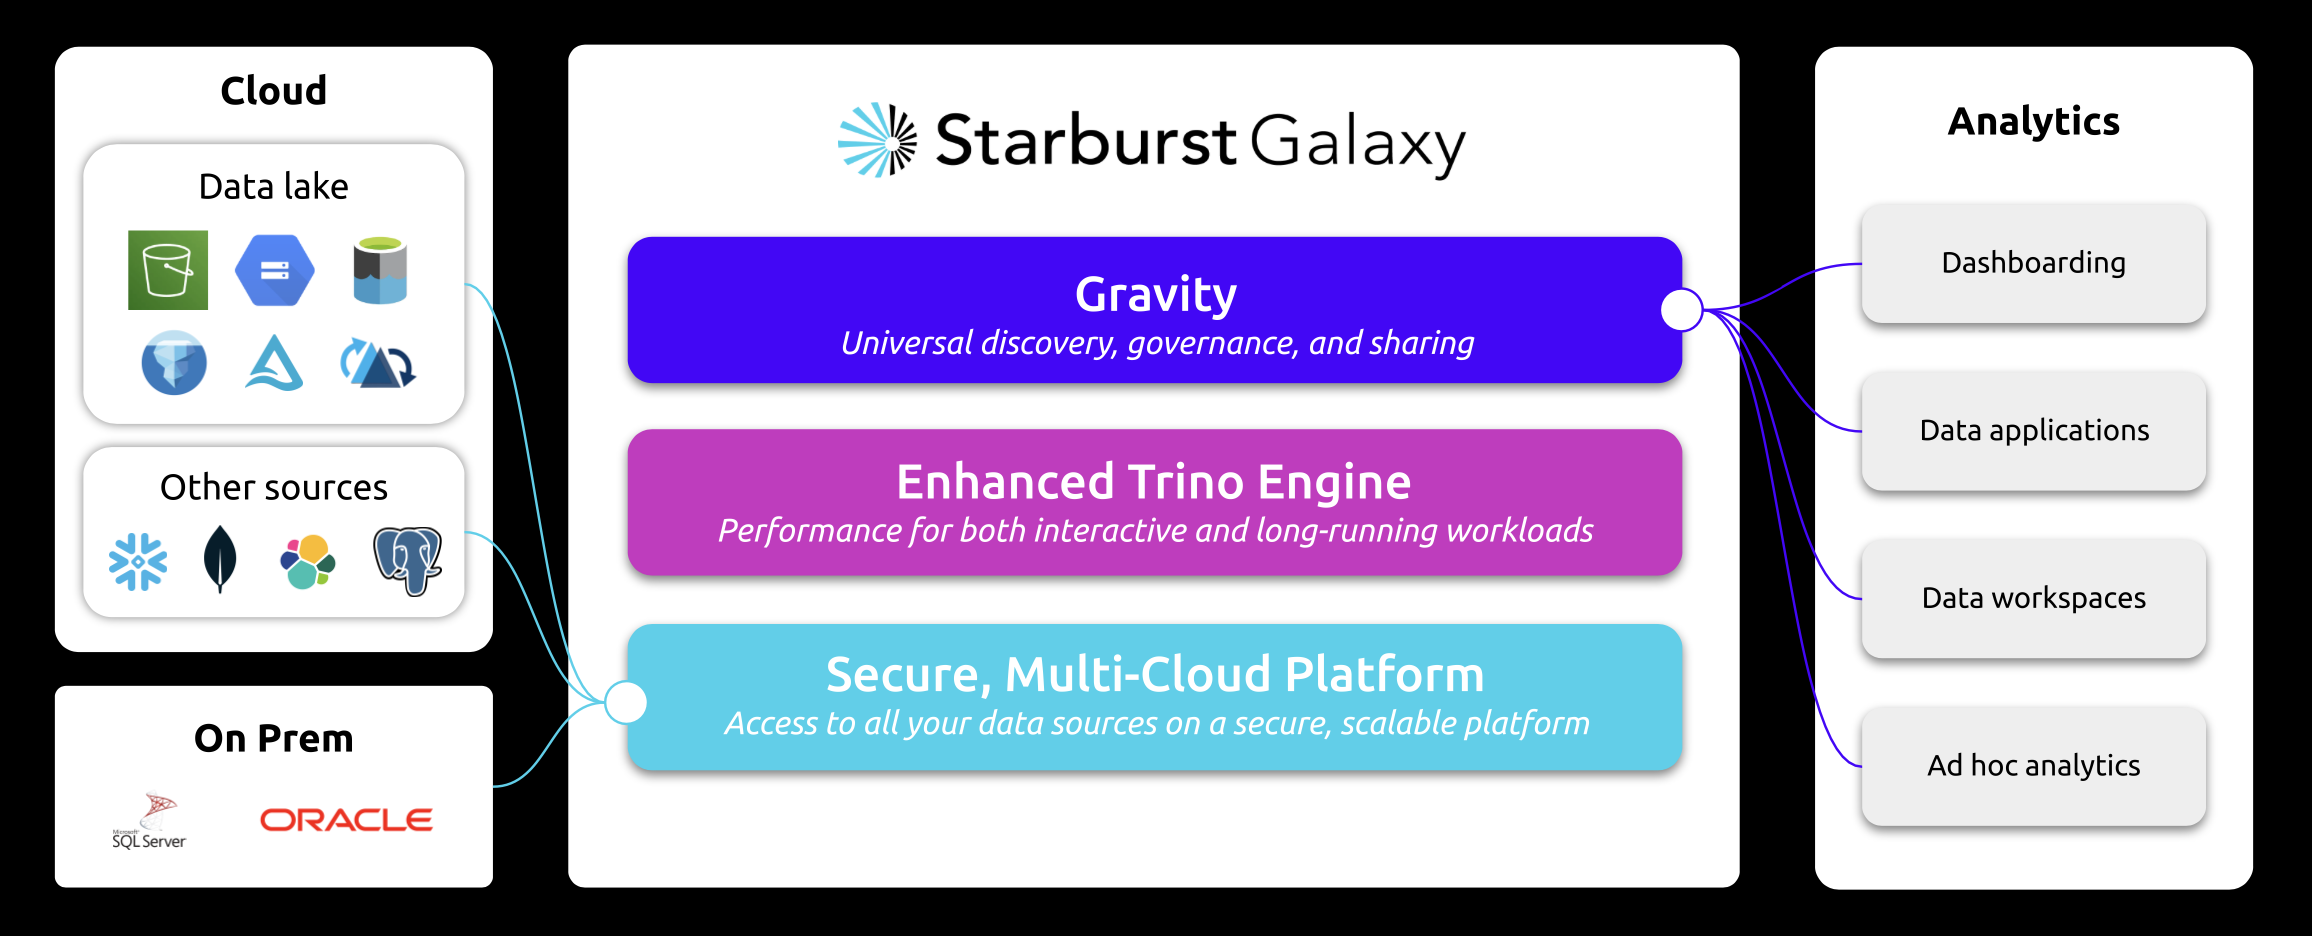
Workflow
How is the high level workflow if you use that solution to query your data?
- Connect all your data sources (on-premise / Cloud)
- Query – Run both ad hoc and batch workloads with the massive parallel processing (MPP) engine – Built for analyzing large amounts of distributed data with high concurrency
- Analyze – Surface the data via SQL or using your favourite visualisation, BI and data science toolkits (tableau, jupyter, dbt Labs etc.)
- Share – Create important views of the data with the data products solution which is built in Starburst Galaxy and securely share insights across teams and departments with built-in access controls
- The data products can be your favourite BI tool for example to create a kind of a dashboard.
Data sources
Some of the data source which are supported in the solution:
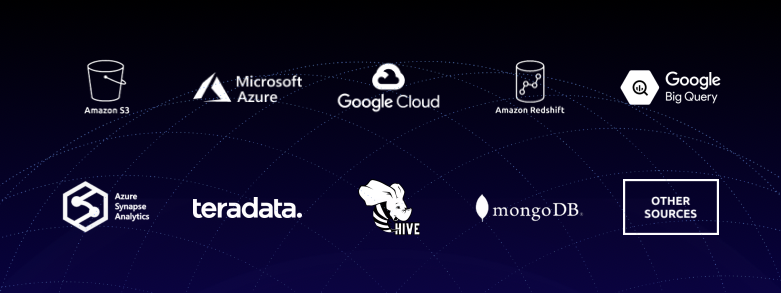
As you can see you have a lot of choices with regards to data source. Google Cloud, Google Big Query, Microsoft Azure, Amazon S3 etc.
The benefit
What is now the benefit of that example solution Starburst Galaxy?
Well, let me split my answer into two different areas. We have on the one side the Data Security and Compliance perspective and on the other side the Business Intelligence view.
Data security and compliance
The Data Security and Compliance benefits are focusing exactly on those. You will have included in the solution an Incident and response program where the roles and responsibilities for all functions are clear defined. Additionally, Access control is in place. That makes sure the access to confidential data is granted on a needed-to-know basis and only the minimum level of access required to satisfy business needs is granted.
Another important control mechanism is the Policy based Access control and that for roles and attributes. That means in addition to the known control based on roles you can set a level of control based on attributes. As an example, you can control the access to tables, schema, catalog etc. based on attributes, which can be for example a tag.
Important: You have to configure such tags upfront.
Risk assessment – Starburst conducts annual risk assessments and manages a risk register which is reviewed regularly. A risk management program is in place to identify and prioritize risks, and ensure appropriate application of resources to minimize any negative impact.
Change management and control – Starburst applies a systematic approach to managing change so that changes to services impacting Starburst and the customers are reviewed, tested, approved, and well communicated. All changes deployed to production undergo a review, testing, and approval process.
Certifications
Certifications – of course the solution has severals certifications like System and Organization Controls (SOC) 2 Type 2 which is possible and a ISO / IEC 27001 certification.
If we look from a Business Intelligence standpoint, with Starburst we will get some of the following advantages.
- User-friendliness with a central UI / platform for data and governance
- The ability to derive meaningful business intelligence across multiple data source (described above)
- Same policy can be applied to a catalog, schema, table, view or column
- Great overview of policies, simplifying policy usage and management
- Ad hoc, batch or scheduled workloads with the massive parallel processing (MPP) engine
- Analyse large amounts of distributed data with high concurrency
- You will get the time that was needed to get the query done
- Connect your BI tool of choice for a dashboard like view of data with data products
- Share insights across teams and departments with built-in access control
I hope you got a good basic understanding of the solution and what it´s capable of.