Often in my engagements with Customers I will be asked how they can troubleshoot a Horizon VDI infrastructure and where they several logfiles will be find.
Event database
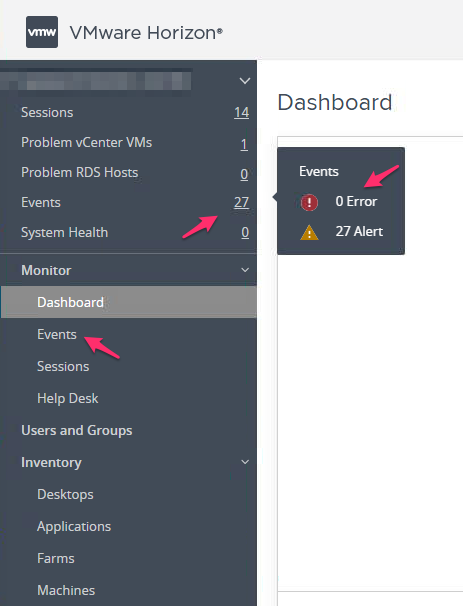
First of all, I recommend to install an Event database based on Microsoft SQL Server and integrate it in the VMware Horizon Connection Server. Please use a full SQL Server version not an express one! With that in mind you can track several events from the events tab in the Connection Server like logon User, time of the login, was there an issue like Agent not reached, or has the user requested an application session and from which Pool and such things. That give you on short hand a quick overview whats going on in your environment. If you see a red indicator on the left side panel, make sure you will check that and solve the potential issue.
In the new Web based UI you have the Events in the short menu on the top left and in the Monitor section.
VMware Logon Monitor
Another cool tool is the VMware Logon Monitor which will be installed as part of the Horizon Agent. Please be aware, that per default this tool will be installed but the service for this, will be set to manual and will be in a stopped state.
In a usual virtual machine it´s not an issue at all. go to the services.msc or click services menu in Windows. Search for “VMware Horizon View Logon Monitor” service. Right click – properties – tab General and set service start type to automatic. After apply and ok, right click the service again and click start. Restart the machine (VM) and from now on, the service will start automatically with the machine.
In an environment with cloning technology like Instant or linked clones its a bit different. Simple reason, if you reboot the Instant clone, it will be deleted. To make the changes here, same procedure as above but you have to do it in the Golden (Master Image) and deploy a new version (Snapshot) for the Pool or create a new one to have the feature available by default in a VMs.
The VMware Logon Monitor will be integrated with the Horizon Help Desk Tool timing profiles. That means you can see Logon-related events and metrics there. Information will be sent to the Horizon Events database as well.
Per default you will find the log files of the Logon Monitor here: c:\ProgramData\VMware\VMware Logon Monitor\Logs.
The Logon Monitor integrates with other VMware products as well like App Volumes and Dynamic Environment Manager (DEM). It will track login related events to give an overview whats happened during the logon process and how long does it takes.
The Logon Monitor service has a lot of metrics which supports to understand the logon flow of the user and where the time taken during that process. That helps with performance tuning in a virtual desktop infrastructure as well. More in the blog article Horizon performance tuning.
Horizon Help Desk Tool
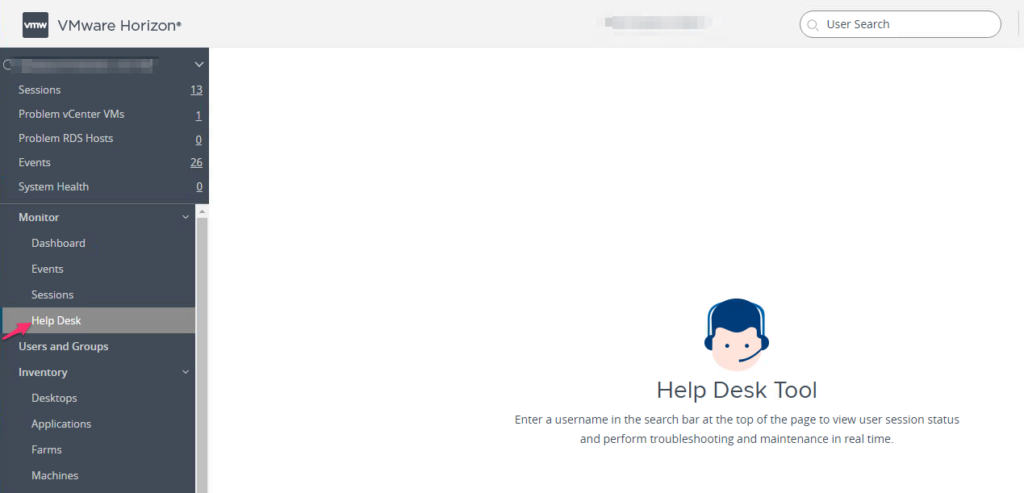
Another piece of troubleshooting and monitoring is the Horizon Help Desk Tool. With that tool you can check the status of the virtual desktop sessions and perform troubleshooting or maintenance tasks. You will get a quick overview whats going on in the environment (sessions) and can restart or reset the sessions for instance.
You will get a quick overview of your current sessions, desktops and applications you´re assigned to and activities which going on. For that use the Help Desk on the left side panel, type in your username on the top right corner in the search box. Click on the session which you want to analyse.
Now you will see an overview of your sessions, desktops, applications and activities.
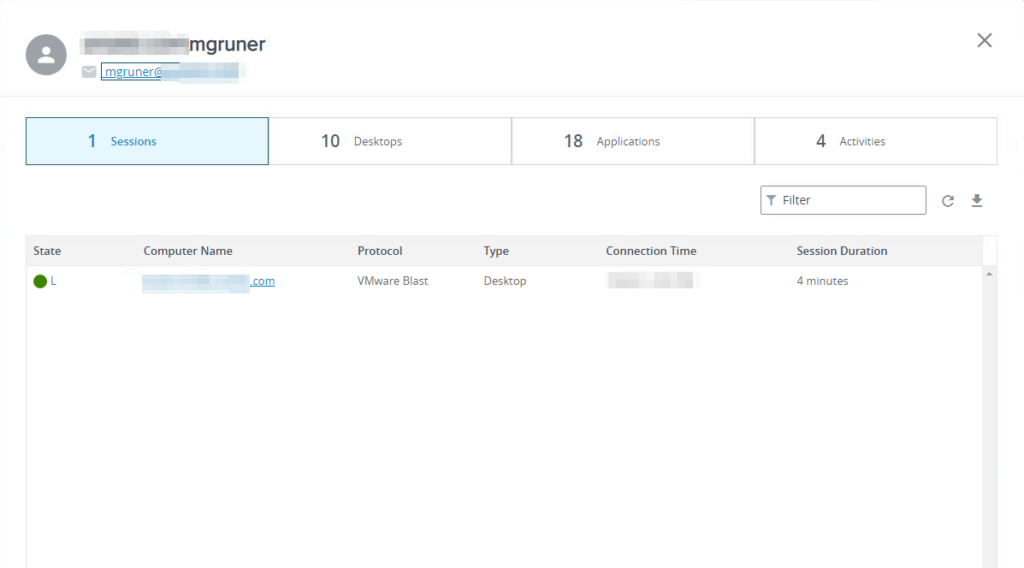
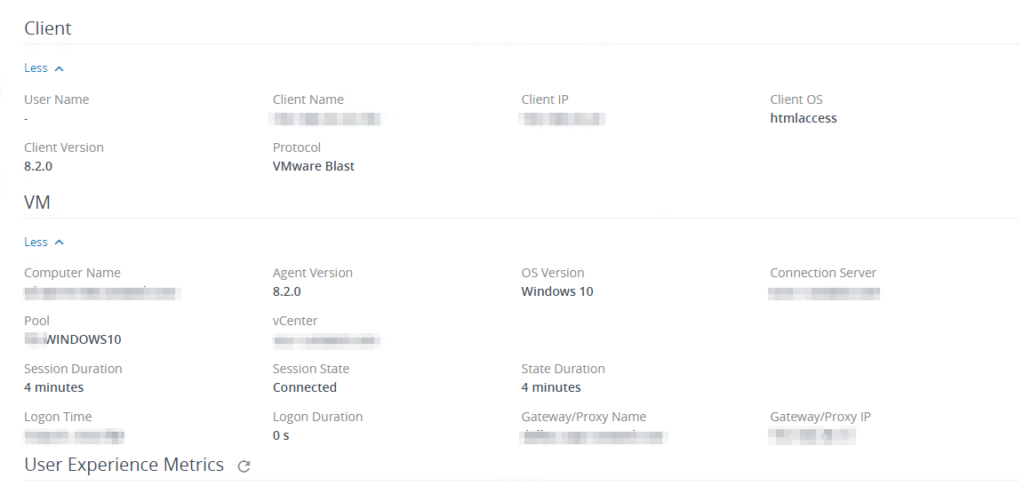
If you click on the session which is shown above in the screenshot, you will get an overview of several metrics like CPU usage, Memory usage, Network performance, Disk performance etc.
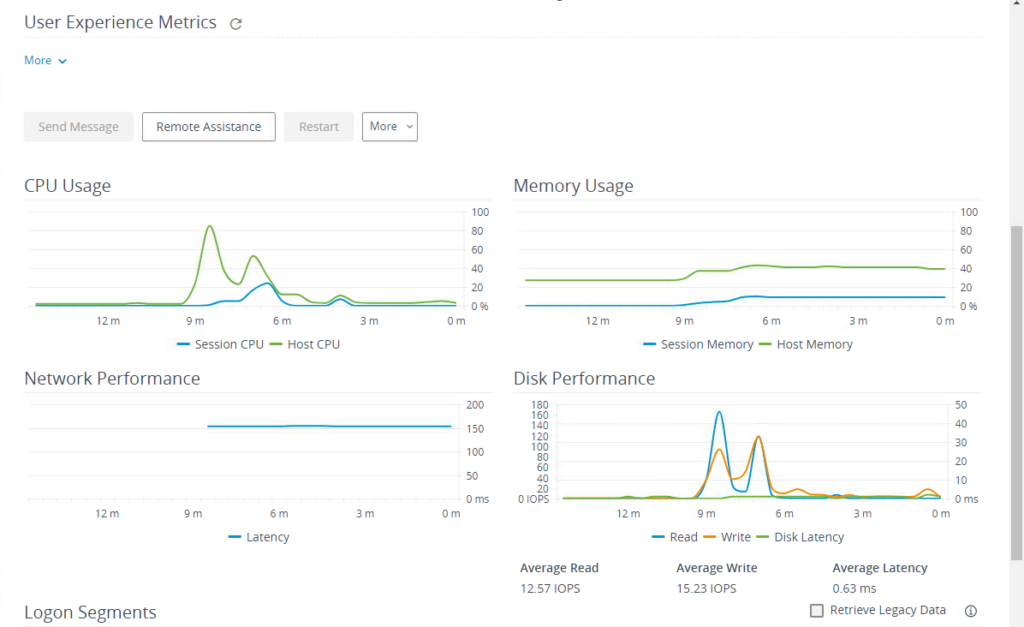
But you can see a lot of Client information as well like IP-Address, Client version, Agent version, vCenter etc.
